Prospective students and their families increasingly consult AI assistants when deciding where to study. This report reviews the public evidence — surveys, web-analytics studies, and query-monitoring analyses published between 2023 and 2026 — on the adoption of AI assistants in education and study-abroad decisions. Across independent studies in the United States, the United Kingdom, and among international students, the pattern is consistent: a steep, replicated adoption curve. In the United States, the share of high-school seniors using AI to explore colleges rose from 4% (2023) to 23% (2025). In a UCAS survey of 4,485 prospective UK applicants (November 2025), 48% had used AI to explore their university options. Among 1,622 newly-enrolled international students surveyed in the US and UK in September 2025, 17% used AI in their initial school research. Every figure is reported with its source and, where disclosed, its sample and window; the known bias toward vendor-published data is stated openly. The evidence establishes that visibility in AI answers is now both consequential and measurable for education institutions.
Summary
Choosing where to study is one of the most consequential decisions a household makes, and the tools people use to make it are changing. Between 2023 and 2026, a series of independent studies — annual student surveys, web-analytics analyses, and query-monitoring reports — recorded the same thing from different angles: prospective students and their families have begun to consult AI assistants when researching institutions, programs, and destinations, and the share doing so is rising quickly.
This report reviews that public evidence. It is a literature review of student and market behavior, not a measurement study; it reports what named sources have published, at the level of detail needed to judge whether their conclusions follow. The organizing finding is an adoption curve that is steep and, more importantly, replicated. In the United States, the share of high-school seniors using AI tools to explore colleges rose from 4% in 2023 to 10% in 2024 to 23% in 2025 in one annual survey [1]. A separate survey of more than 5,000 US high-school students, fielded in late 2025, found 46% using AI tools such as ChatGPT in their college search, up from 26% in spring 2025 [4]. In the United Kingdom, a UCAS survey of 4,485 prospective applicants fielded in November 2025 found 48% had used AI to explore their university options [8]. Among newly-enrolled international students surveyed in 2025, 17% reported using AI in their initial school research [2]. No single study is decisive on its own; the weight of the evidence lies in the agreement among them.
Beyond the headline adoption rate, the behavior already shapes outcomes: 18% of surveyed US high-school students had removed a college from consideration based on information surfaced through AI-generated results [4]. When an audience of this size treats AI answers as a first source of information, and acts on them, whether an institution appears in those answers — and how it is characterized — becomes a measurable and consequential fact about that institution’s market position.
A caution runs through the whole record. Much of the available data on AI visibility and referral behavior is published by companies that sell services in the same market, and figures of this kind are strongly dependent on the time window in which they were measured. This report names every publisher, reports every statistic with its source and — where the publisher disclosed them — its sample and window, and restricts its factual claims to survey-grade and analytics-grade sources. Where a number rests on a single vendor’s estimate, it is labeled as such and not treated as established fact. A later edition will report market-level visibility from direct, repeated measurement rather than from review of others’ studies; it is previewed here without a committed date.
Scope and method
This review covers the demand side of AI use in education decisions: how prospective students and families discover, compare, and decide, and the role AI assistants now play in that process. It does not assess any product, service, or vendor, and it makes no recommendation. Its scope is deliberately narrow — the observed behavior of the audience — because that behavior is the premise on which the case for measuring institutional visibility rests.
Sources were included only if they meet one of two criteria. The first is survey-grade evidence: a named organization’s survey of a defined population, with a stated fielding window and — where the publisher disclosed it — a sample size (the Carnegie [1], INTO University Partnerships [2], EAB [4], UCAS [8], IDP Education [9], Pew Research Center [10], and ACT [12] surveys, and the Everspring analysis of search interactions [3]). The second is analytics-grade evidence: a study of observed behavior — web referrals, query monitoring, or official usage statistics — with a stated method and stated limitations (the Cues.ai referral analysis [5], the Semrush clickstream figures [6], the query-coverage estimate [7], and the CNNIC national statistic [11]). Not all survey-grade sources are equally positioned: UCAS is the UK’s national admissions service and Pew Research Center a nonprofit research organization, neither of which sells services in this market, and their agreement with the vendor-published sources materially strengthens the record’s independence. Claims that could be traced to only a single vendor’s self-reported estimate are admitted sparingly, and only when explicitly labeled as single-source; the query-coverage figure in this report is the one such case [7].
Every statistic is reported inline with its source and — where the publisher disclosed them — its sample size (n) and time window; no bare percentage appears without attribution. This discipline is not cosmetic. A visibility or adoption figure without its denominator and its date is not interpretable, and — as the referral evidence below shows — the same underlying behavior can look explosive or negligible depending on whether it is expressed as a growth rate or an absolute count.
The record carries a known and systematic bias that the reader should hold in mind throughout: a large share of the public data on AI adoption, referral behavior, and answer coverage is published by firms that operate commercially in this space. That does not make the data wrong. Vendor-published survey data can be methodologically sound, and several of the surveys here report large samples and plausible internal consistency. But the incentive to publish findings that make the phenomenon look large is real, and the appropriate response is transparency rather than exclusion: name the publisher, report the sample and window, prefer figures corroborated across independent sources, and decline to launder single-source estimates into settled facts. That is the standard applied here.
Two conventions follow from this. Where the evidence is observational, this report describes association rather than cause: that a young-skewed user base overlaps the recruitment-age population, not that it drives any particular outcome. And because several of the studies sampled live AI engines, one caveat applies to all of them: these results describe the engines as sampled during their respective windows; engines change without notice, and results should be assumed perishable.
The adoption curve
The single most useful picture in the public record is chronological. Placed on a timeline, the independent studies trace one curve rather than a scatter of unrelated data points, and the curve rises steeply. The table below collects the principal findings; the sections that follow examine each population in turn.
| Window | Source and method | Population | Finding |
|---|---|---|---|
| 2023 → 2025 (annual) | Carnegie, annual college-search survey (n ≈ 3,400+ students and parents) [1] | US high-school seniors | Used AI to explore colleges: 4% (2023) → 10% (2024) → 23% (2025) |
| 2025 report (450k+ interactions) | Everspring, 2025 higher-ed trend report [3] | US prospective students | ~2/3 say they turn to an AI tool before using Google for education research |
| 2025 | INTO University Partnerships, survey reported by ICEF Monitor [2] | Newly-enrolled international students | 17% used AI in initial school research |
| Oct–Nov 2025 | EAB, survey (n > 5,000) [4] | US high-school students | 46% used AI tools such as ChatGPT in college search (up from 26% in spring 2025); 18% removed a school on an AI-generated result |
| Nov 2025 | UCAS, applicant survey (n = 4,485) [8] | Prospective UK applicants | 48% used AI to explore university options; 73% of respondents had received incorrect information from an AI tool |
| Jul–Aug 2025 | IDP Education, Emerging Futures survey (n = 7,900) [9] | Prospective international students | 54% plan to use AI to choose institution, 53% to choose subject (up from 35% / 38% in Aug 2024) |
| Sep–Oct 2025 | Pew Research Center, teen survey (n = 1,458) [10] | US teens aged 13–17 | 57% have used AI chatbots to search for information |
| W35 2024 → W42 2025 | Cues.ai, web analytics across 20 UK universities [5] | Institutional referral traffic | Weekly ChatGPT referral visits grew ~2,677% (≈31 → ≈860 per week) |
| 2025 | Semrush Trends, clickstream analysis [6] | ChatGPT vs. Google users | 46.7% of ChatGPT users aged 18–24 vs. 24.7% of Google users |
| May 2025 → Dec 2025 | BrightEdge AI-Overview tracking (single-source estimate) [7] | Education-related queries | AI Overviews present on ~83% of queries by Dec 2025 (up from 18% in May 2025) — among the highest of any sector |
The value of the table is not any one row. It is that surveys and analytics studies conducted by different organizations, using different methods, on different populations — US high-school seniors, US high-school students broadly, newly-enrolled international students, and observed referral traffic — all point the same way over the same period. The two US survey series are the clearest to compare directly: Carnegie’s seniors moved from 4% to 23% across three annual waves [1], and EAB’s broader high-school sample moved from 26% to 46% across two waves in 2025 [4]. These are different instruments measuring overlapping populations, so their levels should not be equated; what is shared, and what matters, is the slope. A figure that roughly doubles or better across successive annual measurements, in more than one independent series, is the signature of genuine diffusion rather than sampling noise.
The remaining rows extend the same pattern beyond survey self-report and beyond the United States. The Everspring analysis moves from “did you use AI” to a stated ordering — about two-thirds of prospective students saying they turn to an AI tool before using Google for education research, drawn from an analysis of more than 450,000 search interactions [3]. The INTO survey extends the curve to the international-student population, where the study-abroad decision has its own structure [2]. The Cues.ai study replaces self-report entirely with observed server-side referral behavior [5]. And the query-coverage estimate describes the supply side — how often education queries now return an AI-generated answer at all [7]. Each is examined below with its caveats; together they make the adoption curve difficult to attribute to any single instrument’s artifact.
United States
The US evidence is the densest, and it comes from two independent survey programs plus supporting analytics.
The first is an annual college-search survey that has tracked AI use across three waves. Among US high-school seniors, the share reporting that they used AI tools to explore colleges rose from 4% in 2023 to 10% in 2024 to 23% in 2025 [1]. The 2025 wave drew on responses from more than 3,400 prospective students and parents. The progression — roughly a doubling and then better than a doubling — is the arc that gives this report its shape, and because it comes from a repeated instrument on a stable population, it is the cleanest single measurement of adoption velocity in the record.
The second is a larger, broader survey of US high-school students fielded in October and November 2025 and released in early 2026, with more than 5,000 respondents [4]. It found that 46% of students used AI tools such as ChatGPT in their college search — described in the release as nearly half — up from 26% in spring 2025, a gain of roughly 20 percentage points in about six months. The same survey supplies the report’s most consequential behavioral finding, discussed in a later section: 18% of respondents had already removed a college from consideration based on information surfaced through AI-generated results [4]. The two US survey programs are not measuring the identical population and should not be pooled, but they corroborate each other on both direction and pace.
Two further data points bracket the arc. At the early end, an ACT survey of 4,006 US students in grades 10–12, fielded in June 2023, found 46% already using AI tools in general but only 10% considering AI for college-admissions essays [12] — general adoption preceded decision-stage adoption by about two years. At the late end, the Pew Research Center — a nonprofit research organization with no commercial stake in this market — found that 57% of US teens aged 13–17 had used AI chatbots to search for information (n = 1,458, fielded September–October 2025) [10]. The cohort now treats assistants as an ordinary information channel in general, which is the base rate against which the college-search figures above should be read: decision-stage use is not an outlier behavior but a specialization of an already-normal one.
Two supporting observations frame why this adoption should register with education institutions specifically. The first concerns the supply side. In one query-monitoring analysis, the share of education-related queries returning a Google AI Overview rose from 18% in May 2025 to roughly 83% by December 2025 — among the highest penetration of any sector tracked [7]. This figure is a single-source estimate and is treated as such here: it is one vendor’s monitoring result, not a corroborated fact, and it is cited to illustrate order of magnitude rather than to fix a precise value. Even discounted, it indicates that education is a category in which AI answers are frequently present rather than occasional, so the question of what those answers say is not hypothetical.
The second concerns who is using these tools. Clickstream analysis reports that ChatGPT’s user base skews young: 46.7% of ChatGPT users were aged 18–24, compared with 24.7% of Google’s users [6]. This is an observation about audience composition, not about any causal effect, and it should be read that way. But the observation is directly relevant to recruitment, because the 18–24 band overlaps the traditional-age prospective-student population closely. An assistant whose users are disproportionately of college age is, mechanically, an assistant whose answers reach a large share of the recruitment audience. The overlap does not by itself establish influence on enrollment; the survey evidence on consideration-set changes, reviewed below, is what connects reach to consequence.
United Kingdom
The UK record adds what the US record lacks: a measurement by the admissions system itself. UCAS, the national undergraduate admissions service, surveyed 4,485 potential applicants, applicants, and first-year students in November 2025, with findings published by its senior insight lead in March 2026 [8]. 48% had used AI to explore their university options. Among those users, 61% used it to compare universities, 59% to explore subject choices, and 52% to look up entry requirements — the comparative, cross-institution questions that prospectuses, league tables, and open days have historically answered.
The same survey complicates two convenient narratives, in opposite directions. First, AI is not yet the default starting point: only 13% of respondents said they would begin their research with a chatbot, against 43% who would start with university websites [8]. Second, students report substantial exposure to error: 73% of all respondents said they had recognized or received incorrect information from an AI tool before [8]. Both findings temper, without reversing, the adoption picture. The channel is widely used, incompletely trusted, and consulted alongside rather than instead of official sources — which makes the accuracy of what assistants say about an institution an operational issue for that institution, not a hypothetical one.
China and international students
The international-student population is where the study-abroad decision is most elaborate — multi-country, multi-source, high-stakes, and historically intermediated by agents and printed materials. In September 2025, INTO University Partnerships surveyed 1,622 newly-enrolled international students in the United States and the United Kingdom; the results were reported by INTO’s Senior Vice President for New Partner Development in ICEF Monitor, with the underlying data attributed to INTO [2]. Across the full cohort, 17% said they had used AI tools such as ChatGPT as part of their initial search.
That average conceals a sharp variation by country of origin. Nearly 30% of students from South Korea and the Philippines reported using AI in their initial search, along with 28% from Taiwan, 25% from Vietnam, and 22% from Japan. Mainland China sat at 21% [2].
The survey publishes figures for these six origin markets only. India — the top-sending country of international students in the United States for the second consecutive year, ahead of mainland China [13] — is not broken out; it falls within “South Asia, Latin America and Africa,” which the article describes as showing more modest uptake without quantifying it. The by-origin range above is therefore a range over the six published markets, not over all origins, and the cohort average of 17% implies that the unpublished origins sit below it.
China is the market this report examines in most detail — one of the two largest source markets for the major English-speaking destinations, with a long, research-intensive decision chain. Its 21% rate sits just below its East and Southeast Asian peers, on one of the largest bases of students anywhere; one in five of the newly-enrolled Chinese cohort having used AI at the initial-research stage is the more consequential reading than the country’s rank among its neighbors. Like every figure here, it is a point-in-time measurement of a fast-rising behavior — surveyed in September 2025 — and is better read as a floor than as a settled rate.
Two further measurements locate that floor in context. First, intent runs well ahead of recalled behavior. IDP Education — a commercial student-recruitment organization, so a vendor source in the sense the method section describes — surveyed 7,900 prospective international students in July–August 2025: 54% planned to use AI tools to help choose their institution and 53% to choose their subject, up from 35% and 38% in its August 2024 wave [9]. (Secondary coverage additionally reports above-average rates for students from mainland China, but that breakdown is not in the cited article and is not used here.) These figures are reported from trade-press coverage of a gated report — the same provenance class as the INTO survey — and they measure intent among prospects rather than recalled behavior among the enrolled. The gap between IDP’s 54% and INTO’s 17% is therefore not a contradiction: the populations differ, intent overstates behavior, and the waves sit a year of steep adoption apart. Second, the domestic context makes Chinese adoption legible. CNNIC, China’s official internet statistics body, put the country’s generative-AI user base at 515 million by June 2025 — 36.5% of the population, with 74.6% of users under 40 [11]. The statistic carries no study-abroad breakdown and is cited only as context: the cohort now deciding on study abroad comes from an environment in which generative AI is a mass consumer technology, not a novelty.
The study-abroad context makes this adoption legible. An international student compares institutions across countries, weighs immigration and cost, and has traditionally relied on intermediaries to compress a large and unfamiliar information space — and the survey’s account of what students asked matches that task: 61% asked about university rankings and reputation, 39% about program or course details, 34% about career outcomes, and 34% about student life [2]. These are the comparative, cross-institution questions that prospectuses and agents have historically answered.
Students also rated the result highly. Among those who used AI, 96% said its guidance either met or exceeded the quality of information from traditional sources such as websites, brochures, and agents — 81% finding it more helpful and 15% about the same [2]. This is a self-reported perception, not an audit of accuracy, and should be read as such; what it establishes is that, for the students using them, AI tools are not a supplementary novelty but a channel judged at least equal to the incumbents. The evidence throughout is behavioral and attitudinal rather than causal: it records that newly-enrolled international students are using AI at the research stage and rate it well, not that AI has displaced any particular traditional channel.
Acting on AI answers
Adoption rates describe how many people use a tool. What makes them consequential is evidence that the behavior changes decisions — and the clearest such evidence in the public record is behavioral rather than attitudinal.
In the EAB survey of more than 5,000 US high-school students fielded in October and November 2025, 18% had removed a college from consideration based on information surfaced through AI-generated results [4]. This is the point at which the evidence crosses from interest to impact. A consideration-set removal is a decision an institution cannot easily recover through later outreach, because it happens before — and often without — any direct contact. Nearly one in five students reporting such a removal means that the content of AI answers is already shaping which institutions remain eligible for consideration, upstream of the funnel that most recruitment measurement observes.
The finding is a survey self-report, and it measures a reported action rather than an audited outcome; it does not establish that the AI-surfaced information was accurate, only that students acted on it. That distinction is preserved deliberately. The claim this report rests on is not that AI guidance is correct, but that a measurable share of prospective students now treat it as decisive enough to narrow their choices on — which is what makes an institution’s presence in those answers worth measuring.
A UK measurement keeps the finding calibrated. In the UCAS survey, only 8% of respondents said a negative review from an AI tool would lead them to drop a university from consideration — far below the 18% of US students reporting an actual AI-prompted removal [4] [8]. The two numbers measure different things in different populations: a hypothetical willingness among UK applicants versus a reported past action among US high-school students, on different instruments, and neither audits what actually happened. Read together they bound the effect rather than fix it (Figure 3). Consideration-set effects are real and present in both markets; their size is not yet uniform, and single-market figures should not be generalized.
From mention to visit
The evidence reviewed so far is about what students do and say. One study measures a downstream trace of that behavior in institutional server logs, and it is worth examining closely both for what it shows and for how easily it can be misread.
An analysis of anonymized web-analytics data from 20 UK universities found that weekly ChatGPT referral visits — clicks arriving at university websites from within ChatGPT — grew approximately 2,677% between Week 35 of 2024 and Week 42 of 2025 [5]. Expressed as a growth rate, the figure is dramatic. Expressed in absolute terms, it is modest: the traffic rose from roughly 31 to roughly 860 referral visits per week across the 20 institutions combined [5]. Both descriptions are true, and reporting only the first would misrepresent the finding. The growth is real and steep; the base is small.
The study is explicit about a further limitation that materially changes its interpretation, and it points in the opposite direction from the small absolute count. Referral visits capture only cases where a student clicked through from ChatGPT to an institution’s website. They do not capture the far larger volume of exchanges in which an assistant names, describes, compares, or recommends an institution and the student never clicks — reading the answer and moving on, or acting on it later through another path [5]. In other words, referral traffic undercounts AI exposure, and probably by a wide margin: mention is not click, and click-based measurement sees only the fraction of exposure that terminates in a visit. This is the central methodological point for anyone tempted to gauge AI’s influence from referral logs alone. The visible clicks are a lower bound on a larger, mostly unobserved surface of exposure, and the direction of the measurement error is known even though its size is not.
The honest reading of the Cues.ai study is therefore twofold. The absolute referral numbers remain small and should not be inflated. And precisely because referrals undercount exposure, the small referral count is weak evidence against AI’s reach, not strong evidence for it: the same behavior that produces a few hundred weekly clicks may be producing far more mentions that leave no click-shaped trace. The two observations resolve the apparent tension between the survey evidence (adoption is large and rising) and the referral evidence (clicks are still few): clicks are simply the wrong instrument for measuring exposure, and a better instrument is needed.
Why this matters for measurement
The studies reviewed here converge on a single conditional. If a large and rising share of the audience for education decisions consults AI assistants — 23% of US high-school seniors [1], 46% of US high-school students [4], 48% of prospective UK applicants [8], roughly one in six newly-enrolled international students [2] — and if they act on those answers by narrowing their choices [4], then whether an institution appears in AI answers, and how it is characterized there, is a consequential fact about that institution’s market position. The premise is what the evidence in this report establishes; the conclusion is the reason the phenomenon is worth measuring at all.
The referral study shows why the obvious instrument is inadequate. Click-based analytics see only exposures that end in a visit, and they therefore undercount the surface that matters — the mentions themselves [5]. What is needed is a measurement that observes the answers directly: how often an institution is named in response to the questions prospective students actually ask, how it is positioned relative to alternatives, and whether that presence is stable enough to be relied upon. That is the object of the companion conventions in this series.
The framing is statistical. An institution’s presence in AI answers is not a fixed attribute but a probability, because the same question asked repeatedly does not return the same answer every time. If an institution appears in of independently sampled answers to a question, its estimated Visibility Probability (VP) is , and it should be reported not as a bare percentage but with a confidence interval,
so that the estimate carries its own uncertainty. (Near 0 or 1 — where an individual institution’s visibility often sits — this normal approximation fails, and the interval must come from a boundary-valid construction such as the Wilson score interval; BA-C-2 §2 governs the choice.) The sample size required to resolve a visibility probability to a target margin of error is approximately , which makes explicit that a credible visibility claim requires enough repeated sampling to distinguish signal from the answer-to-answer variation that engines exhibit. Alongside VP, two further quantities complete the picture: Share of Voice (SoV), the institution’s share of all institution mentions within the same set of sampled answers, and Discovery Depth (DD), the degree of query constraint — how specific a prospective student’s question must become — before the institution first enters the recommended set. The maturity levels for this kind of measurement — from no observability to reliable, sustained visibility — are set out as the Barkhausen Ladder (BL-0 through BL-8) in BA-C-1; the metric definitions are specified in BA-C-2, the sampling requirements in BA-C-3, and the criterion for treating a change in visibility as real rather than as noise — the Barkhausen Criterion: statistically significant, sustained, and not an artifact of an engine update — is formalized in BA-C-3.
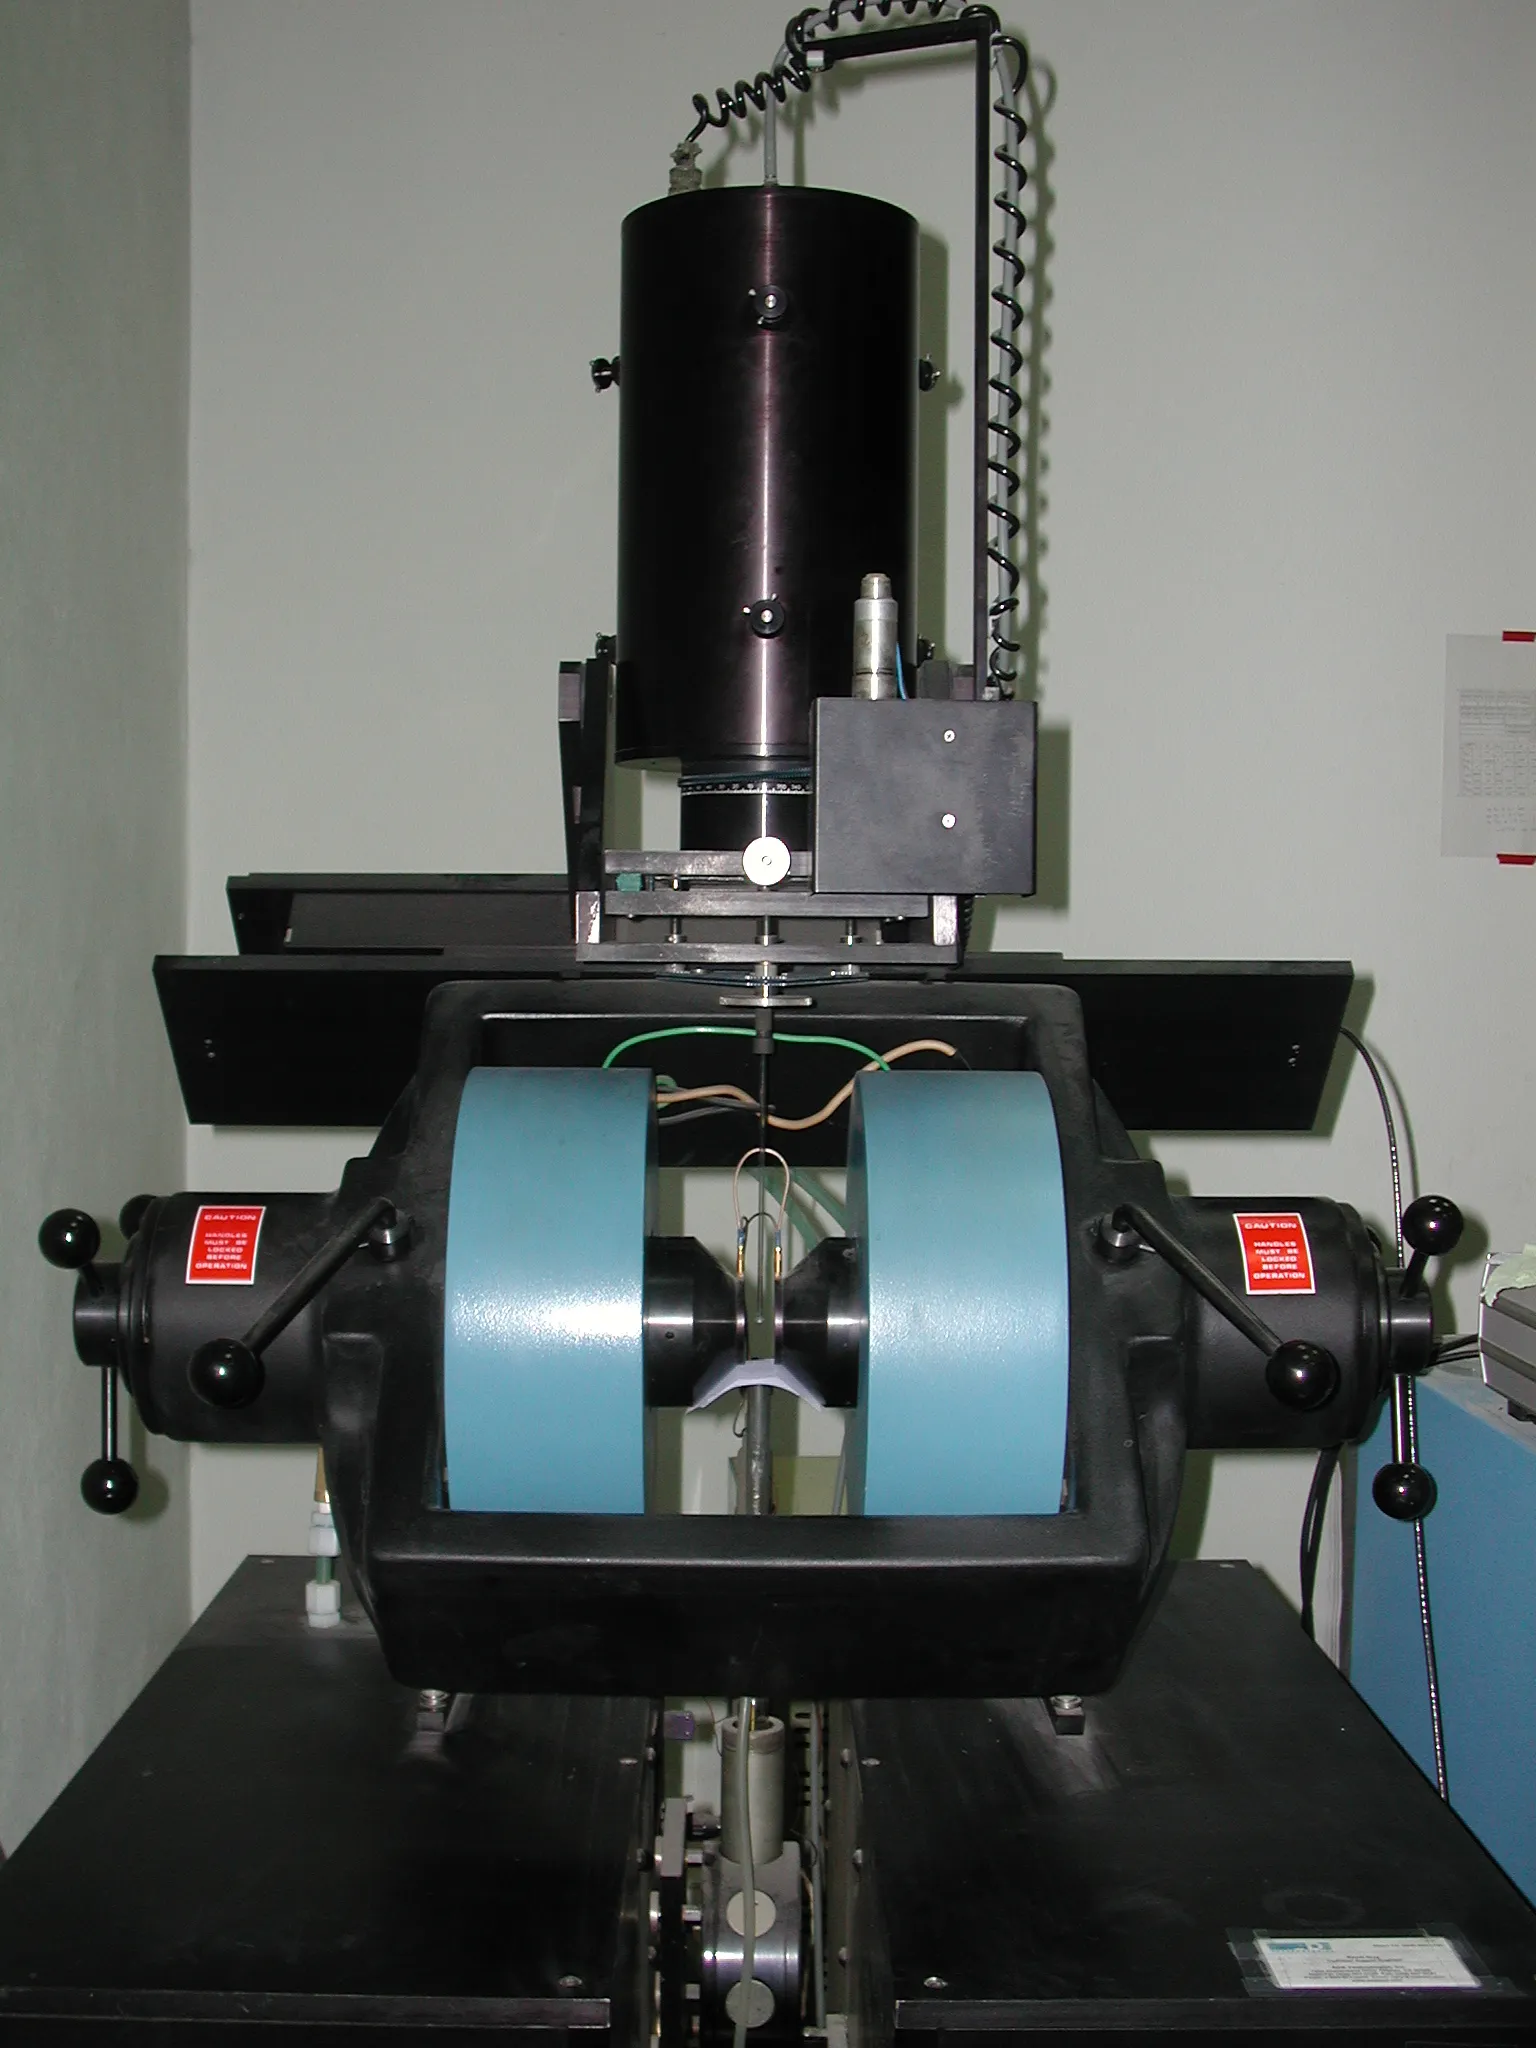
About the name. The framework takes its name from the Barkhausen effect in physics, in which a magnetic material exposed to a smoothly increasing field does not magnetize smoothly but advances in discrete, audible jumps. The analogy is to how visibility in AI answers tends to move — not gradually with effort, but in steps — and it is the reason a visibility claim in this series must satisfy the four-condition Barkhausen Criterion (BA-C-3) — a jump that is significant, sustained, clear of engine-change artifacts, and assessed with multiplicity control — rather than a drift within normal variation.
This report deliberately stops at the premise. It establishes, from public evidence, that the audience is present and that the behavior is consequential; it does not measure any institution’s visibility. A later, market-level edition will report visibility from direct, repeated sampling under the conventions above, so that the adoption curve documented here can be paired with a measured account of who is visible in the answers that audience now consults. That edition’s design is pre-registered as a study protocol (BA-R-2026-02) — the estimands, cell sizes, channels, naming policy, and change criteria are fixed in public before any data is collected; no publication date is promised.
Limitations
This review is bounded by the evidence it rests on, and several limitations should temper how its findings are used.
Vendor-published data. A large share of the sources here — the referral analysis [5], the clickstream figures [6], the query-coverage estimate [7], the trend analysis [3], and the international-student surveys [2] [9] — is published by organizations that operate commercially in the market they describe. This does not invalidate the data, and several of the surveys report substantial samples with plausible internal consistency. But it introduces a systematic incentive toward findings that make the phenomenon look large, and it means the record has not been assembled by disinterested parties. The mitigations applied here are transparency of attribution, preference for figures that recur across independent sources, and refusal to treat single-vendor estimates as established fact. They reduce the bias; they do not remove it.
Time-window dependence. Every figure in this report is a snapshot of a moving target. Adoption rates are rising, AI engines change their behavior without notice, and referral and coverage measurements can shift substantially between measurement windows. These results describe the engines and the audience as sampled during their respective windows; they should be assumed perishable, and any figure cited here should be checked against a current measurement before it is relied upon for a decision.
Small absolute numbers in the referral evidence. The most concrete behavioral trace in the review — ChatGPT referral visits to UK universities — remains small in absolute terms (hundreds of weekly visits across 20 institutions), even as its growth rate is large [5]. The growth is genuine, but the base is low, and the study’s own caveat that clicks undercount exposure means the referral figures are a poor proxy for reach in either direction. They should be read as a lower bound on an unobserved larger surface, not as a measure of total influence.
Self-report. The survey findings on adoption are self-reported, and self-report is subject to recall and framing effects that this review cannot correct. Reported use of a tool is not a measure of how much that use influenced a decision; the one behavioral outcome relied on here — removals from a consideration set [4] — is itself a survey self-report of a reported action, not an audited outcome, and independent, non-self-reported confirmation of AI’s influence on enrollment is outside the scope of this review.
Population comparability. The studies cover overlapping but non-identical populations — US high-school seniors, US high-school students broadly, and newly-enrolled international students — using different instruments. Their agreement on direction is the review’s central finding, but their levels should not be pooled or directly equated.
Provenance of the international-student figures. The INTO figures used here — the overall rate, the by-origin breakdown, the question mix, and the quality rating [2] — are drawn from a January 2026 ICEF Monitor article authored by INTO’s Senior Vice President for New Partner Development; its embedded charts are credited “Source: INTO,” and the survey’s population, window, and sample (September 2025, n = 1,622) are stated in the article text. This is first-party in authorship and data ownership, but it is a guest article on a trade-press site rather than a report published on INTO’s own domain, and no underlying methodology document was located; the figures are reported here on that basis. The quality rating (96% met-or-exceeded) is distinct from INTO’s separate, earlier student-satisfaction surveys and should not be conflated with them. The IDP figures [9] share the same provenance class — trade-press coverage of a report whose primary is gated — and only their headline percentages are used here, because sub-details vary across outlets; they additionally measure stated intent among prospects, not recalled behavior, and are labeled as such where cited.
Provenance of the UK figures. The UCAS findings [8] are published in a guest post by UCAS’s senior insight lead on a sector-news site, with the sample (n = 4,485) and fielding window (November 2025) disclosed but no methodology document; ucas.com itself was not the publication venue. UCAS’s position as the national admissions service makes this the least commercially conflicted survey in the record, but the provenance is still a trade-press article, not a statistical release.
Single-source items. One figure — the roughly 83% AI-Overview coverage of education queries by December 2025 [7] — is a single-source estimate (BrightEdge tracking), labeled as such wherever it appears and cited for order of magnitude only. It should not be treated as a settled value. The age-distribution figure [6] rests on secondary coverage of a Semrush analysis for which no primary page could be located, and is carried as an audience-composition observation only.
Geographic coverage. The title’s scope is the world; the assembled public record is not. The decision-stage evidence here covers the United States, the United Kingdom, and internationally mobile students bound for both, with one national-context statistic for China [11]. Continental Europe, Latin America, Africa, and most of Asia have, to date, published no decision-stage evidence that met this review’s inclusion criteria. Their absence reflects the state of the public record, not their unimportance, and is the clearest gap a future edition should close.
Within these bounds, the review’s conclusion is narrow and, taken across the sources, well supported: adoption of AI assistants in education decisions is substantial, rising, and already consequential enough that visibility in AI answers is a measurable property of an institution’s market position worth tracking directly. A market-level measured edition will follow.
References
- 1.Carnegie. AI Use in the College Search (Summer Research Series) (2025). https://www.carnegiehighered.com/blog/research-series-ai-in-college-search/ Accessed 2026-07-08. [archived]
- 2.INTO University Partnerships (T. O'Brien, SVP), via ICEF Monitor. The ChatGPT generation: how AI is quietly rewriting the global student search experience (2026). https://monitor.icef.com/2026/01/the-chatgpt-generation-how-ai-is-quietly-rewriting-the-global-student-search-experience/ Accessed 2026-07-08. [archived]
- 3.Everspring. AI Has Changed How Students Search — And Universities Are Paying the Price (2025 Higher Ed Trend Report) (2025). https://www.everspringpartners.com/ai-has-changed-how-students-search-and-universities-are-paying-the-price Accessed 2026-07-08. [archived]
- 4.EAB. Nearly Half of High School Students Now Use AI in College Search (2026). https://eab.com/about/newsroom/press/ai-in-college-search-survey/ Accessed 2026-07-08. [archived]
- 5.Cues.ai. ChatGPT trends: referral traffic to UK universities (2025). https://cues.ai/chatgpt-trends Accessed 2026-07-08. [archived]
- 6.Semrush (Semrush Trends); figure reported across secondary coverage, no primary Semrush page located. ChatGPT vs. Google user age distribution (clickstream analysis) (2025).
- 7.BrightEdge, reported by Search Engine Journal — single-source estimate. Google AI Overviews surges across nine industries (education AI-Overview coverage) (2026). https://www.searchenginejournal.com/google-ai-overviews-surges-across-9-industries/568448/ Accessed 2026-07-08. [archived]
- 8.UCAS (J. Richards, Senior Insight Lead), via Wonkhe. Three ways prospective students are using AI when applying to higher education (2026). https://wonkhe.com/blogs/three-ways-prospective-students-are-using-ai-when-applying-to-higher-education/ Accessed 2026-07-09. [archived]
- 9.IDP Education (Emerging Futures survey), via ICEF Monitor. Growing use of AI for study abroad decisions highlights importance of multi-channel marketing strategies (2025). https://monitor.icef.com/2025/10/growing-use-of-ai-for-study-abroad-decisions-highlights-importance-of-multi-channel-marketing-strategies/ Accessed 2026-07-09. [archived]
- 10.Pew Research Center. How Teens Use and View AI (2026). https://www.pewresearch.org/internet/2026/02/24/how-teens-use-and-view-ai/ Accessed 2026-07-09. [archived]
- 11.China Internet Network Information Center (CNNIC); title translated from the Chinese original. Report on the Development of Generative Artificial Intelligence Applications (2025) (2025). https://www.cnnic.cn/n4/2025/1021/c88-11391.html Accessed 2026-07-09. [archived]
- 12.ACT (research blog). Half of High School Students Already Use AI Tools (2023). https://industryinsights.act.org/2023/12/students-ai-research Accessed 2026-07-09. [archived]
- 13.Institute of International Education (IIE), Open Doors 2025 press release. Open Doors 2025: International students in the United States (2025). https://www.iie.org/news/open-doors-2025-press-release/ Accessed 2026-07-09. [archived]
How to cite
PDF of recordBarkhausen AI (2026). AI in education decisions worldwide: a review of the public evidence. https://barkhausen.ai/research/ai-in-education-decisions/
BibTeX
@techreport{BA-R-2026-01,
  author       = {{Barkhausen AI}},
  title        = {AI in education decisions worldwide: a review of the public evidence},
  institution  = {Barkhausen AI},
  year         = {2026},
  url          = {https://barkhausen.ai/research/ai-in-education-decisions/}
}
Published under the Creative Commons Attribution 4.0 International (CC-BY-4.0).